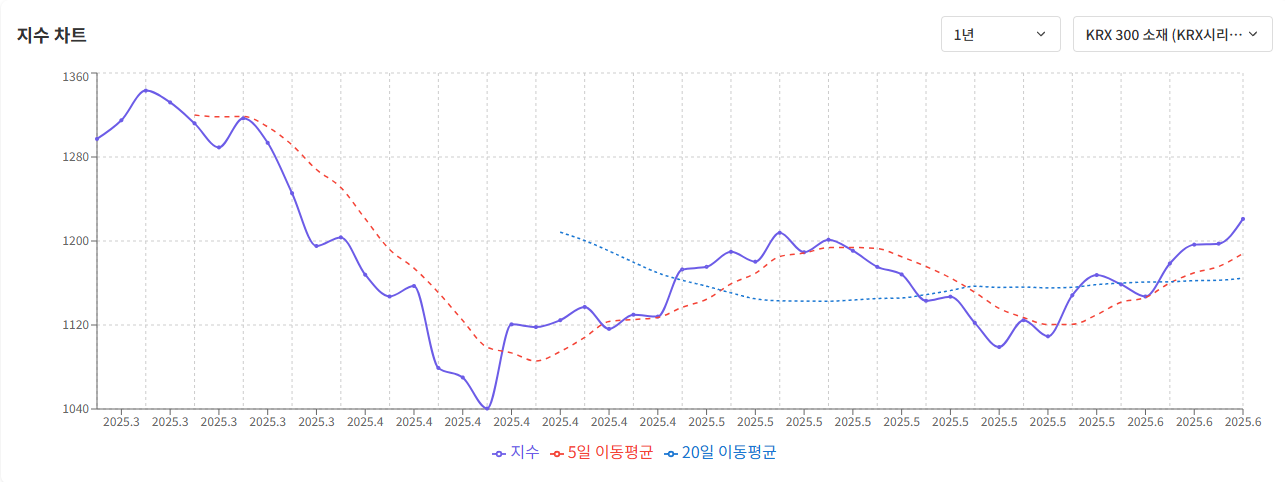
지수 차트
- 월/분기/년 단위 시계열 데이터
    - **{종가}**를 기준으로 합니다.
- 이동평균선 데이터
    - 5일, 20일
    - 이동평균선이란 지난 n일간 가격의 평균을 의미합니다.
    - 예를 들어 3월 13일의 5일 이동평균선은 3월 9일부터 3월 13일까지의 종가의 평균값입니다.

Index Chart
- Based on monthly/quarterly/yearly time-series data of the Closing Price
- Moving Average Line Data
	- 5-day, 20-day
    - A moving average line represents the average price over the last _n_ days.
    - For example, the 5-day moving average on March 13th is the average of the Closing Price from March 9th to March 13th.
Analysis
The returned DTO
public record IndexChartDto(
    long indexInfoId,
    String indexClassification,
    String indexName,
    String periodType,
    List<ChartDataPoint> dataPoints,
    List<ChartDataPoint> ma5DataPoints,
    List<ChartDataPoint> ma20DataPoints) {}

record ChartDataPoint(LocalDate date, double value) {}
The chart
In IndexChartDto
List<ChartDataPoint> dataPoints: main line
represents the actual, day-to-day closing price of the index
This line will likely look jagged, showing daily volatility
List<ChartDataPoint> ma5DataPoints:second line
the 5-day moving average
a “smoothed” version of the price that shows the short-term trend
List<ChartDataPoint> ma20DataPointsthird line
the 20-day moving average
an even smoother line that reveals the long-term trend
Moving Average
To calculate the moving average, you need data from before your chart’s startDate.
Problem: To calculate the 20-day moving average for the first day (startDate) of your chart, you need the closing prices for that day and the 19 previous days.
Solution: You must fetch data starting from startDate minus 20 days (or more precisely, 19 business days, but 20-30 calendar days is a safe buffer).
startDate VS endDate
startDate - the beginning of that time range, calculated by going back in time from today.
endDate - the end of the chart (the most recent date)
Steps
For the given indexInfoId, find the corresponding indexInfo
Depending on chartPeriodType, calculate the startDate
MONTHLY, QUARTERLY, YEARLY
MONTHLY: startDate = today - 1 month
QUARTERLY: startDate = today - 3 months
YEARLY: startDate = today - 1 year (12 months)
Fetch 30 indexData that is before the startDate
Why 30?
To calculate the 5/20 day moving average of the days between startDate and endDate (today), we need maximum of 20 indexData (19 past, 1 today)
Fetch 30 to account for weekends/holidays (we actually only technically need 20)
Database call
We fetch ALL indexData that is from 30 days before the startDate until the endDate, which is the latest date based on findRecentIndexData
Moving average
Calculate ma5DataPoints
For each day D from startDate and endDate (today):
Get the closing prices for the last 5 days: Price(D), Price(D-1), Price(D-2), Price(D-3), Price(D-4)
Use #3’s list
Add all of them
Divide by 5
This result is the 5-day MA value for day D
Create a ChartDataPoint with date D and this calculated average
Calculate ma20DataPoints the same way as #4
Code (1차- inefficient)
This code simply uses the Simple Moving Average (SMA) without the sliding window
It’s inefficient because it recalculates the sum for the entire window at every single step
public IndexChartDto getChartData(long indexInfoId, ChartPeriodType chartPeriodType) { IndexInfo indexInfoDto = indexInfoRepository.findById(indexInfoId) .orElseThrow(() -> new NoSuchElementException("IndexData does not exist")); // 가장 최신 IndexData fetch IndexData latestIndexData = findRecentIndexData(indexInfoId) .orElseThrow(() -> new NoSuchElementException("IndexData does not exist")); // endDate 계산 LocalDate endDate = latestIndexData.getBaseDate(); // chartPeriodType에 따른 startDate 계산 LocalDate startDate = switch (chartPeriodType) { case MONTHLY -> endDate.minusMonths(1L); case QUARTERLY -> endDate.minusMonths(3L); case YEARLY -> endDate.minusYears(1L); }; // startDate 30일전 - endDate의 모든 IndexData을 fetch // sliding window를 위한 data buffer List<IndexData> indexDataList = findRangeIndexData( indexInfoId, startDate.minusDays(30L), // 한달 전 endDate); List<ChartDataPoint> dataPoints = new ArrayList<>(); List<ChartDataPoint> ma5DataPoints = new ArrayList<>(); List<ChartDataPoint> ma20DataPoints = new ArrayList<>(); IntStream.range(0, indexDataList.size()) .filter(i -> !indexDataList.get(i).getBaseDate().isBefore(startDate)) .forEach( i -> { IndexData currentData = indexDataList.get(i); LocalDate currentDate = currentData.getBaseDate(); dataPoints.add(new ChartDataPoint(currentDate, currentData.getClosingPrice())); // 5일 이동평균선 if (i >= 4) { double closingPricetotal = 0; for (int j = 0; j < 5; j++) { closingPricetotal += indexDataList.get(i - j).getClosingPrice(); } closingPricetotal /= 5; ma5DataPoints.add( new ChartDataPoint(indexDataList.get(i).getBaseDate(), closingPricetotal)); } // 20일 이동평균선 if (i >= 19) { double closingPricetotal = 0; for (int j = 0; j < 20; j++) { closingPricetotal += indexDataList.get(i - j).getClosingPrice(); } closingPricetotal /= 20; ma20DataPoints.add( new ChartDataPoint(indexDataList.get(i).getBaseDate(), closingPricetotal)); } }); return new IndexChartDto( indexInfoId, indexInfoDto.getIndexClassification(), indexInfoDto.getIndexName(), chartPeriodType, dataPoints, ma5DataPoints, ma20DataPoints ); }// ==================================== private 메서드 ====================================// 차트 메서드 private List<IndexData> findRangeIndexData( long indexInfoId, LocalDate startDate, LocalDate endDate) { return dashboardRepository.findByIndexInfoIdAndBaseDateBetweenOrderByBaseDateAsc( indexInfoId, startDate, endDate); }
Database calls
/** * 지정된 지수 정보 ID와 기준일자 범위에 해당하는 지수 데이터를 기준일자 오름차순으로 조회합니다. * * @param indexInfoId 지수 정보의 고유 ID * @param startDate 조회 시작일자 * @param endDate 조회 종료일자 * @return 기준일자 오름차순으로 정렬된 {@link IndexData} 객체 리스트 */// Asc - oldest to newest (e.g., Jan 1, Jan 2, Jan 3, ...). List<IndexData> findByIndexInfoIdAndBaseDateBetweenOrderByBaseDateAsc( long indexInfoId, LocalDate startDate, LocalDate endDate);
That database call fetches allIndexData records where the indexInfoId matches and the baseDate falls between the startDate and endDate (inclusive).
It has to be Asc
Sorts from oldest to newest (e.g., Jan 1, Jan 2, Jan 3, …).
BaseDateBetween→ JPA knows to compare between 2 BaseDates
Code (2차 - efficient ✅)
Use a sliding window!
applying a moving average calculation to your time series data
basically the same with 1st code (naive version) but more efficient
Instead of recounting all 20 items every time, you just update the sum from the previous step
Add new value entering the window
Subtract the old value leaving the window
Use the sum to get the average
@Overridepublic IndexChartDto getChartData(long indexInfoId, ChartPeriodType chartPeriodType) { IndexInfo indexInfoDto = indexInfoRepository.findById(indexInfoId) .orElseThrow(() -> new NoSuchElementException("IndexInfo does not exist for id: " + indexInfoId)); // 가장 최신 IndexData fetch IndexData latestIndexData = findRecentIndexData(indexInfoId) .orElseThrow(() -> new NoSuchElementException("IndexData does not exist")); // endDate 계산 LocalDate endDate = latestIndexData.getBaseDate(); // chartPeriodType에 따른 startDate 계산 LocalDate startDate = switch (chartPeriodType) { case MONTHLY -> endDate.minusMonths(1L); case QUARTERLY -> endDate.minusMonths(3L); case YEARLY -> endDate.minusYears(1L); }; // startDate 30일전 - endDate의 모든 IndexData을 fetch // sliding window를 위한 data buffer List<IndexData> indexDataList = findRangeIndexData( indexInfoId, startDate.minusDays(30L), // 한달 전 endDate); List<ChartDataPoint> dataPoints = new ArrayList<>(); List<ChartDataPoint> ma5DataPoints = new ArrayList<>(); List<ChartDataPoint> ma20DataPoints = new ArrayList<>(); double ma5Sum = 0.0; double ma20Sum = 0.0; final int ma5Window = 5; final int ma20Window = 20; for (int i = 0; i < indexDataList.size(); i++) { IndexData currentData = indexDataList.get(i); LocalDate currentDate = currentData.getBaseDate(); double currentClosingPrice = currentData.getClosingPrice(); ma5Sum += currentClosingPrice; ma20Sum += currentClosingPrice; // window가 slide하면, window 밖에 있는 요소를 빼기 //그 전 요소만 빼기 if (i >= ma5Window) { ma5Sum -= indexDataList.get(i - ma5Window).getClosingPrice(); } if (i >= ma20Window) { ma20Sum -= indexDataList.get(i - ma20Window).getClosingPrice(); } // startDate 이후에만 data point 더함 if (currentDate.isEqual(startDate) || currentDate.isAfter(startDate) ) { dataPoints.add(new ChartDataPoint(currentDate, currentData.getClosingPrice())); // window 사이즈 이후 // 0,1,2,3,4 -> 5개니까 4부터 시작 if (i >= ma5Window - 1) { // 평균값 구하기 위해 /5 ma5DataPoints.add(new ChartDataPoint(currentDate, ma5Sum / 5)); } if (i >= ma20Window - 1) { // 평균값 구하기 위해 /20 ma20DataPoints.add(new ChartDataPoint(currentDate, ma20Sum / 20)); } } } return new IndexChartDto( indexInfoId, indexInfoDto.getIndexClassification(), indexInfoDto.getIndexName(), chartPeriodType, dataPoints, ma5DataPoints, ma20DataPoints ); }